Plot the similarity against expression levels
Source:R/plot_expression_similarity.R
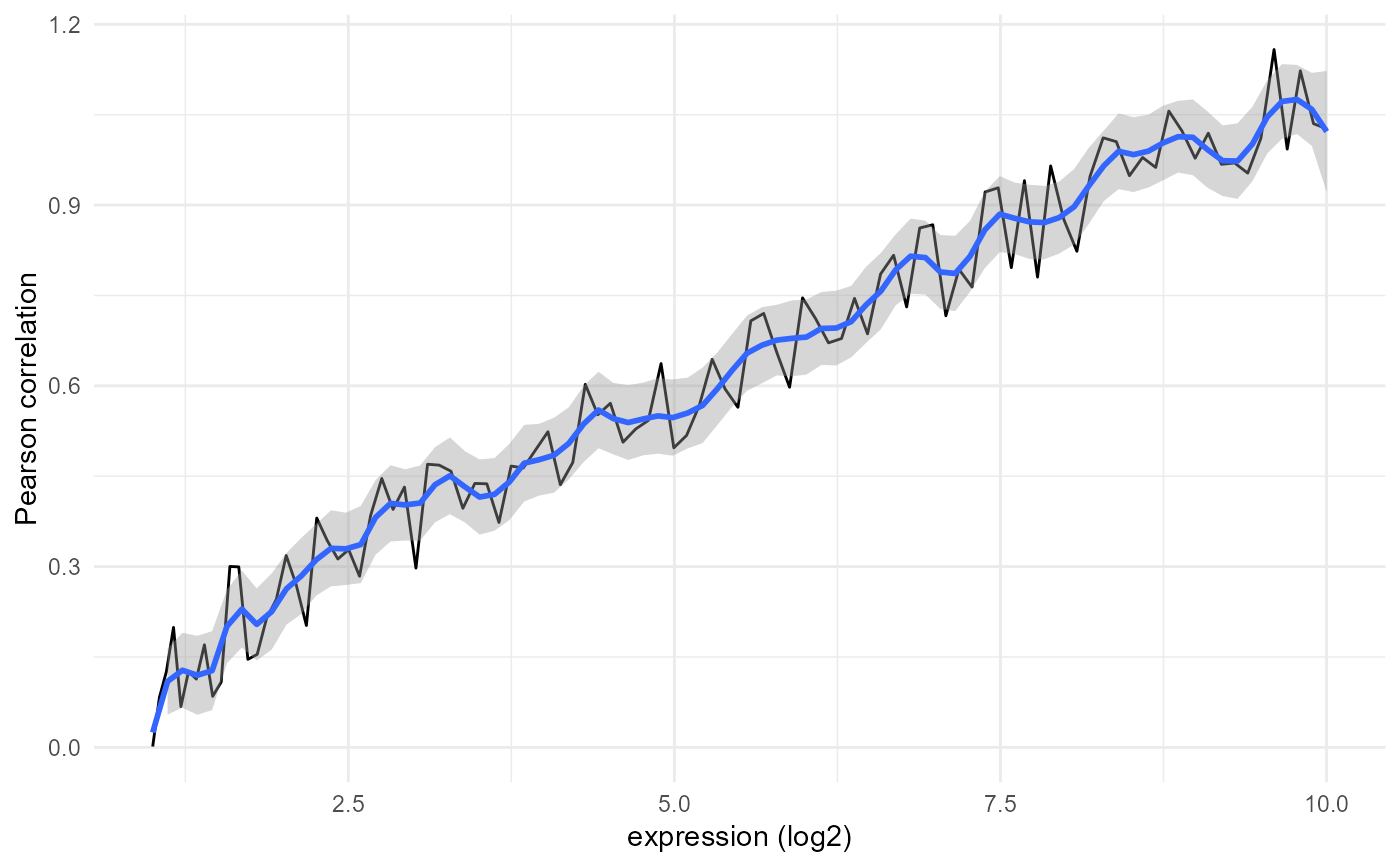
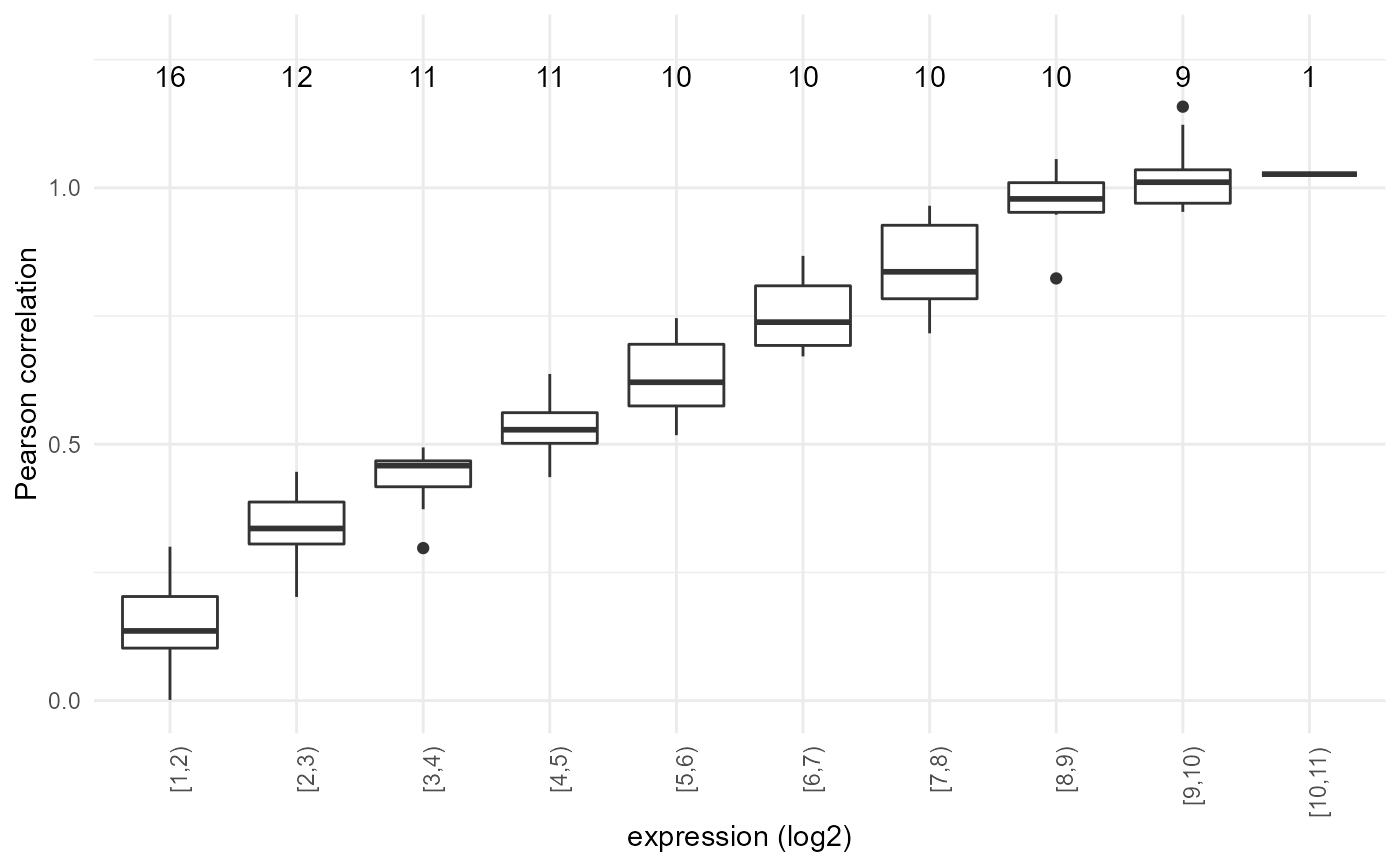
plot_expression_similarity.RdCreates the expression-similarity line and box plots for each sample.
plot_expression_similarity(
  expression.summary,
  sample.names = NULL,
  similarity.name = "Pearson correlation",
  log.transform = TRUE,
  min.y = NULL,
  max.y = NULL,
  smooth.span = 0.1,
  only.boxplot = FALSE,
  binsize = 1,
  last.together = 0,
  show.counts = TRUE,
  add.threshold = NULL,
  file.name = NULL
)
Arguments
| expression.summary | list containing expression_levels and expression_levels_similarity
matrices, as calculated by |
|---|---|
| sample.names | names for the plots, defaults to the column names of the expression matrix |
| similarity.name | similarity metric used (for the y-axis title) |
| log.transform | should the count matrix be log-transformed? If not, boxplot is skipped |
| min.y, max.y | limits for the y axis. If unset default to symmetric including all values in expression.levels.similarity; min is set to 0 if there are no negative values |
| smooth.span | span to be used for smoothing in the line plot; defaults to 0.1 |
| only.boxplot | option to skip the line plot (usually a good idea if there are too many points and lines are too erratic); sets log.transform to TRUE |
| binsize | size of each bin in the boxplot; defaults to 0.5 |
| last.together | groups observations so the highest abundance bin has at least this many |
| show.counts | whether to show how many observations are in each bin |
| add.threshold | adds a horizontal line at this value |
| file.name | name of pdf to output the plots; if not provided (default), no printing is done |
Value
A list of all the plots (returned silently)
Examples
plots <- plot_expression_similarity( expression.summary=list( "expression.levels" = matrix(2^(10*seq(0,1,length.out=100))), "expression.levels.similarity" = matrix(seq(0,1,length.out=100)+(runif(100)/5)))) plots[[1]]plots[[2]]