Function to find the first local minimum of the density of a vector
Source:R/calculate_first_minimum_density.R
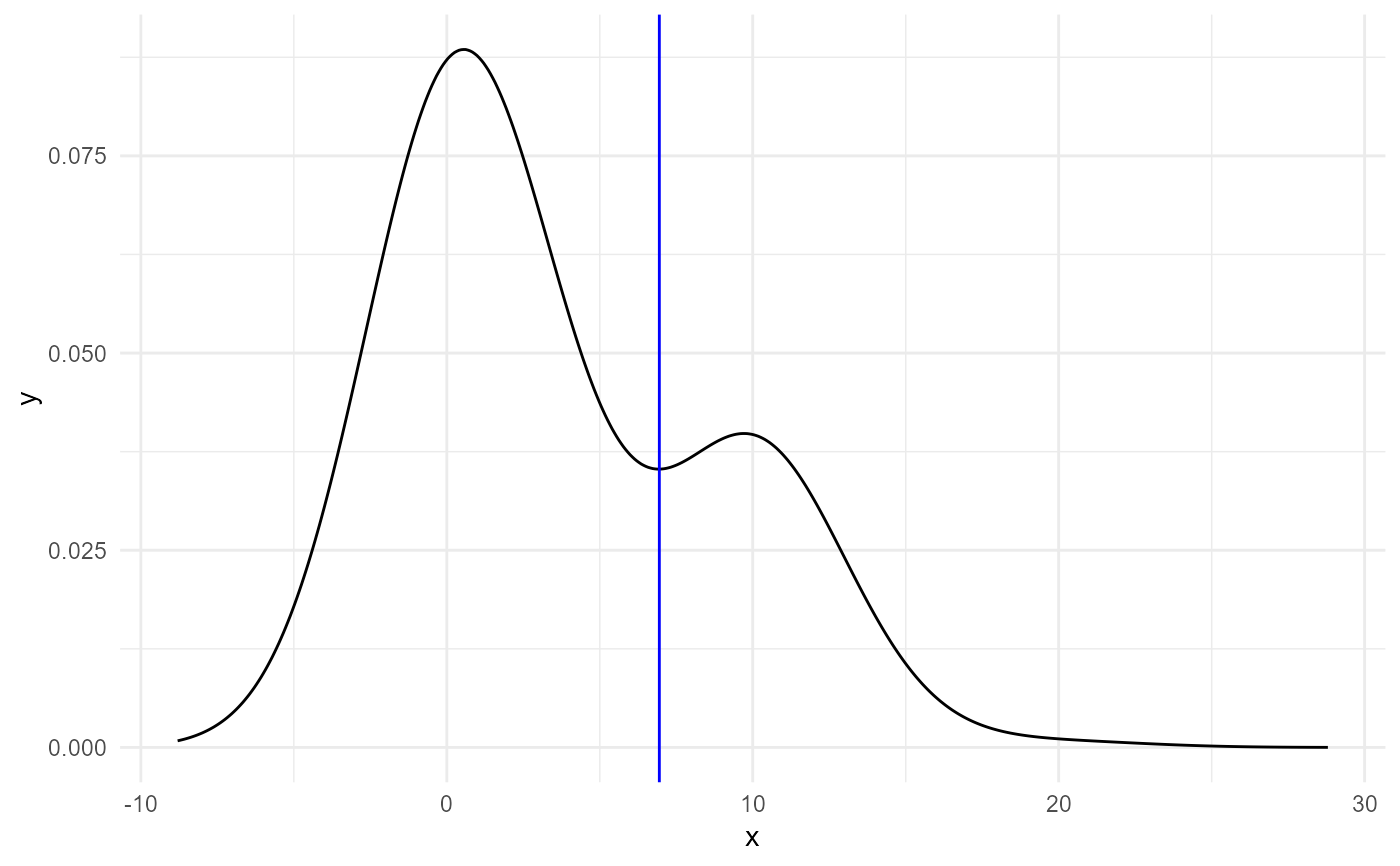
calculate_first_minimum_density.RdThis function is used to estimate the first local minimum of the density of a vector. It is meant to be used on the distribution of expression of genes in a sample; since the distribution tails off, finding the global minimum is not appropriate. The plot option can be used to visualise the process.
calculate_first_minimum_density(
  mat,
  log.transform = TRUE,
  adjust = 2,
  makeplots = FALSE
)
Arguments
| mat | matrix whose columns will be used; usually an expression matrix; it can also be a vector |
|---|---|
| log.transform | whether to log-transform the data before the density estimation; default is TRUE |
| adjust | adjust factor for the smoothing, passed to density(); default is 2 |
| makeplots | a logical value of whether a plot with a vertical line on the minimum found should be printed for each column of the matrix. |
Value
The function outputs a single value corresponding to the median of the minima calculated for each column of the matrix. floor() is taken as a conservative estimate
Examples
calculate_first_minimum_density( matrix(c(rep(0,100),rep(3,30),rep(10,50),12,13,15,20),ncol=1), log.transform=FALSE, makeplots=TRUE )#> [1] 6