Calculate the expression profile of a gene
Source:R/calculate_expression_profile.R
calculate_expression_profile.RdThis function calculates the expression profile of an exon in a selection of BAM files. The expression profile is defined as the number of reads overlapping with each position of the exon's transcript.
calculate_expression_profile(
  gene,
  bams,
  unique.only = TRUE,
  mapq.unique = c(50, 255),
  slack = 200
)
Arguments
| gene | The exon for which the expression profile is calculated; this should be
a row from the tibble generated by |
|---|---|
| bams | a vector of paths to the BAM files from which the profile is extracted |
| unique.only | whether only uniquely mapped reads should contribute to the profile; default is TRUE |
| mapq.unique | The values of the mapping quality field in the BAM file that corresponds to uniquely mapped reads; by default, values of 50 and 255 are used as these correspond to the most popular aligners, but an adjustment might be needed |
| slack | slack needs to be >=readLength, adjust for efficiency; the default is 200, as it is higher than most modern sequencing experiments |
Value
The function outputs a list: the first element is a matrix of expression profiles. Rows correspond to positions in the exon transcript and each column corresponds to an input BAM file. Each read is counted for all the positions with which it overlaps (so a read of length 100 that completely overlaps with the exon would be counted for all 100 positions). The second list element is a vector of raw expression of the gene in the different BAM files
Examples
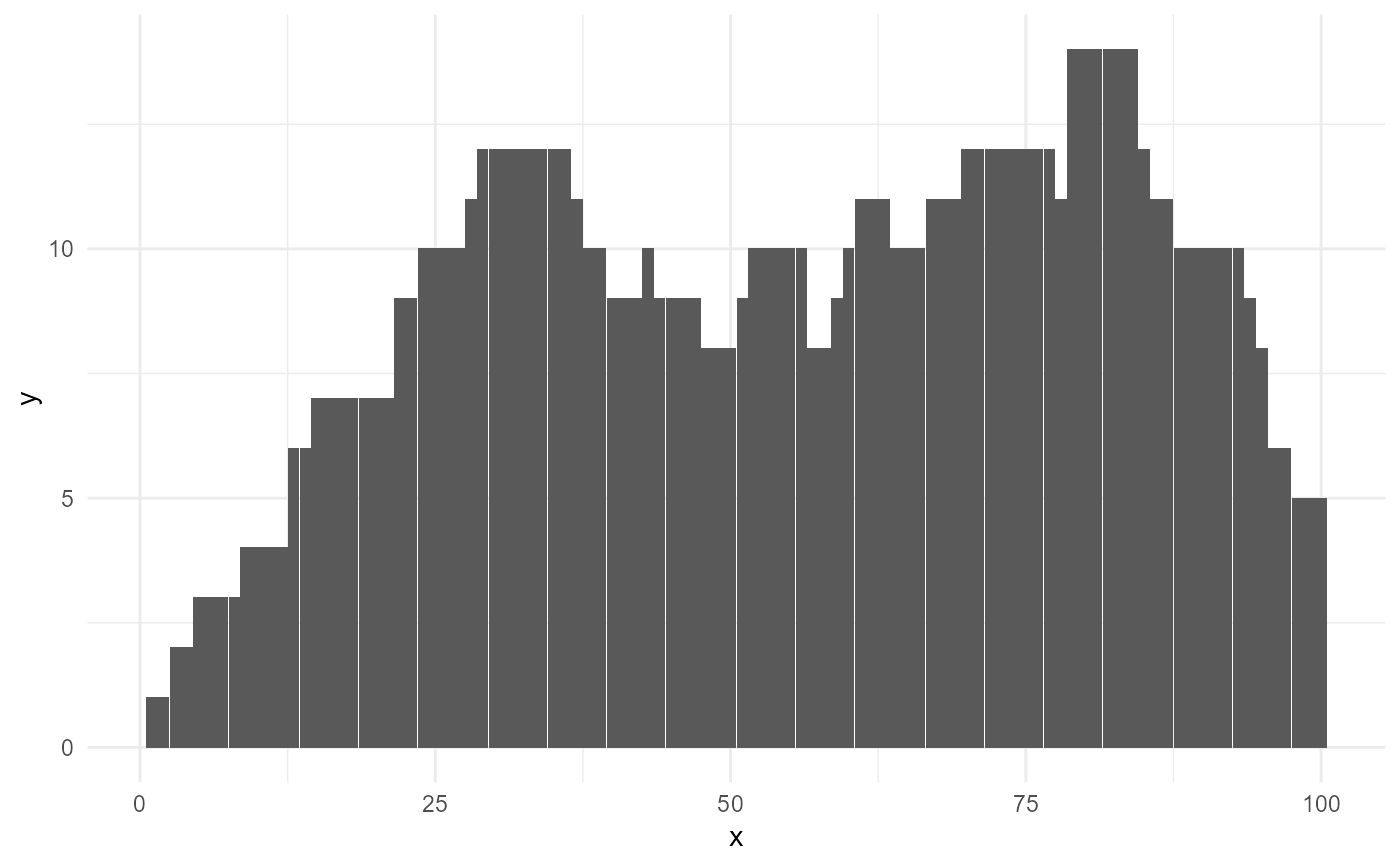
bams <- rep(system.file("extdata", "ex1.bam", package="Rsamtools", mustWork=TRUE), 2)
genes <- data.frame("id" = 1:2,
                    "gene_id" = c("gene1", "gene2"),
                    "seqid" = c("seq1", "seq2"),
                    "start" = 1,
                    "end" = 100)
profile <- calculate_expression_profile(
  gene = genes[1,],
  bams = bams,
  mapq.unique = 99
)

ggplot2::ggplot(tibble::tibble(y = profile$profile[,1],
                               x = seq_along(y))) +
ggplot2::geom_bar(ggplot2::aes(x, y), stat = "identity") +
ggplot2::theme_minimal()