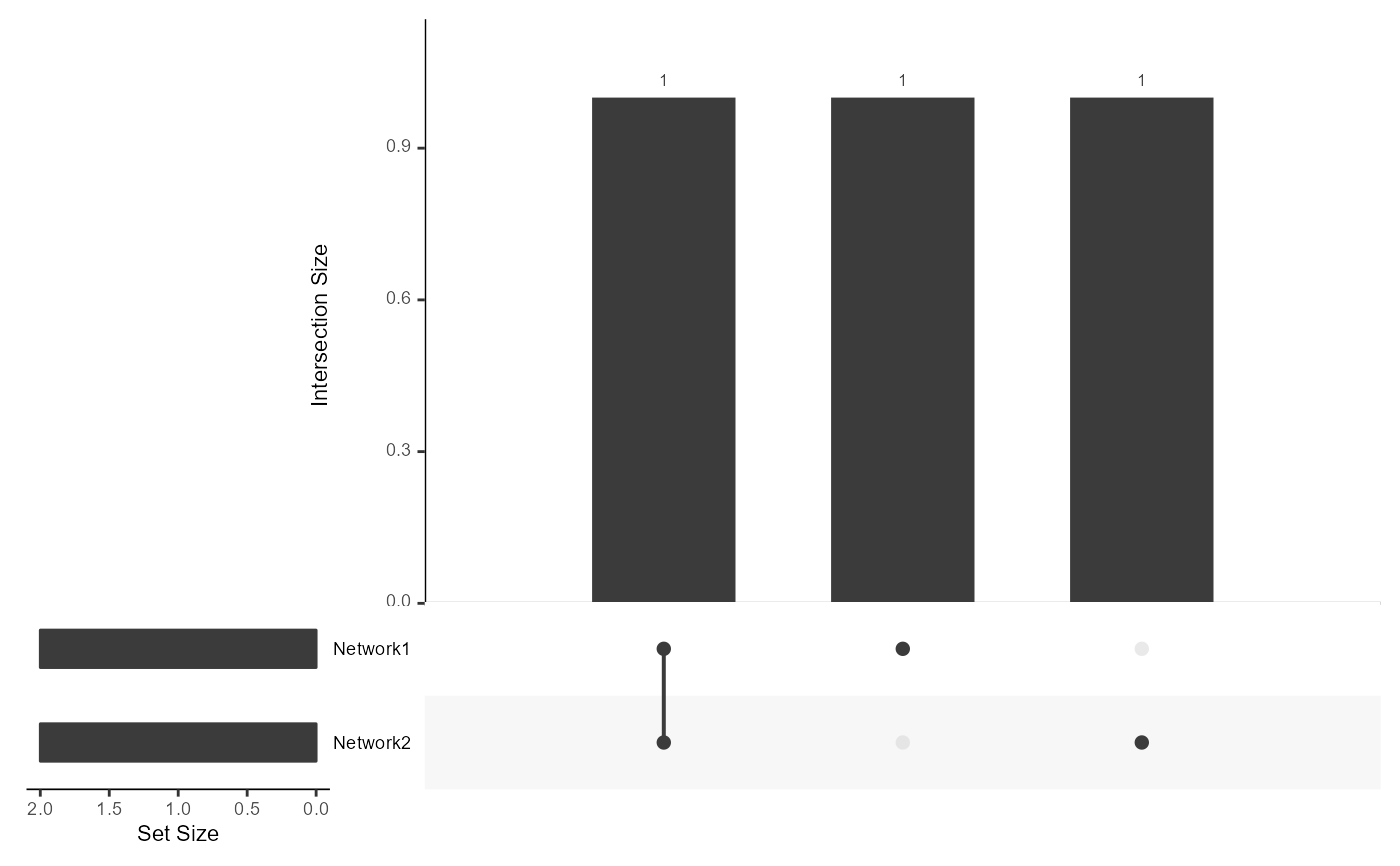
This function creates an UpSet plot of the intersections and specific differences of the edges in the input networks.
Arguments
- weightMatList
a list of (weighted) adjacency matrices; each list element must be an adjacency matrix with regulators in rows, targets in columns
- plotConnections
the number of connections to subset to
Examples
weightMat1 <- matrix(
  c(0.1, 0.4, 0.8, 0.3), nrow = 2, ncol = 2,
  dimnames = list("regulators" = c("r1", "r2"), "targets" = c("t1", "t2"))
)
weightMat2 <- matrix(
  c(0.1, 0.2, 0.8, 0.3), nrow = 2, ncol = 2,
  dimnames = list("regulators" = c("r1", "r2"), "targets" = c("t1", "t2"))
)
plot_upset(list(weightMat1, weightMat2), 2)