Create a line plot of average expression across conditions
Source:R/patternFuns.R
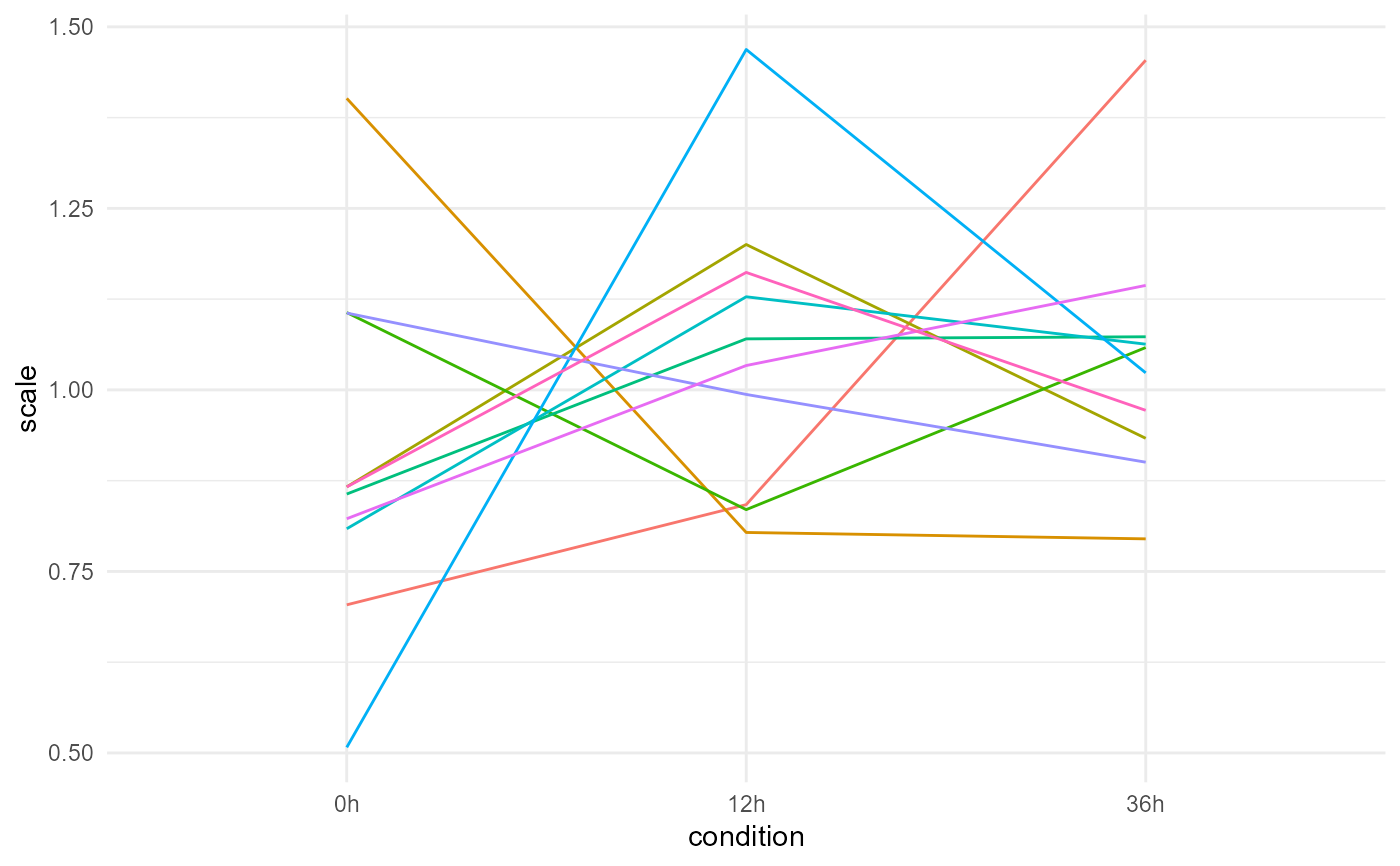
plot_line_pattern.RdThis function creates a line plot of average expression across conditions for a selection of genes, usually to visualise an expression pattern.
Usage
plot_line_pattern(
  tbl,
  genes = NULL,
  type = c("Mean Scaled", "Log2 Expression", "Expression"),
  show.legend = FALSE
)
Arguments
- tbl
the output of
calculate_condition_mean_sd_per_gene- genes
gene names to use for the output; if NULL (the default), all genes will be used
- type
whether the expression values should be scaled using their mean (default), log-transformed, or not adjusted for the plot
- show.legend
whether to show the gene names in the legend; should be avoided in many genes are plotted
Examples
expression.matrix.preproc <- as.matrix(read.csv(
  system.file("extdata", "expression_matrix_preprocessed.csv", package = "bulkAnalyseR"),
  row.names = 1
))[1:500,]

condition <- factor(rep(c("0h", "12h", "36h"), each = 2))
tbl <- calculate_condition_mean_sd_per_gene(expression.matrix.preproc[1:10, ], condition)
#>
  |
  |                                                                      |   0%
  |
  |======================================================================| 100%
plot_line_pattern(tbl)