Create a heatmap of the Jaccard similarity index (JSI) between samples of an experiment
Source:R/QCplotFuns.R
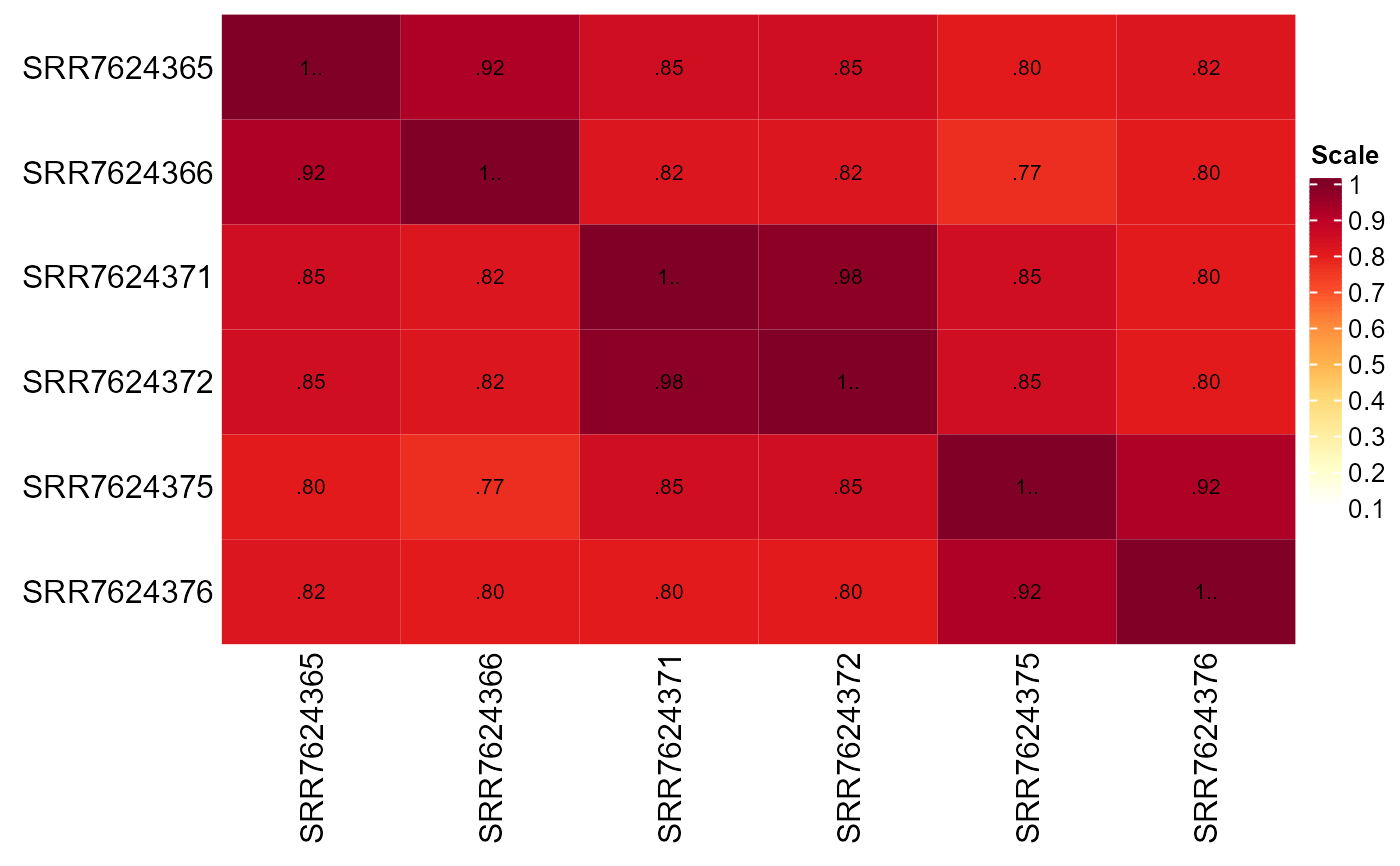
jaccard_heatmap.RdThis function creates a JSI heatmap between all samples in the expression matrix using the specified number of most abundant genes as input. Metadata columns are used as annotations.
Usage
jaccard_heatmap(
  expression.matrix,
  metadata,
  top.annotation.ids = NULL,
  n.abundant = NULL,
  show.values = TRUE,
  show.row.column.names = TRUE
)
Arguments
- expression.matrix
the expression matrix; rows correspond to genes and columns correspond to samples; usually preprocessed by
preprocessExpressionMatrix; a list (of the same length as modality) can be provided if #'length(modality) > 1- metadata
a data frame containing metadata for the samples contained in the expression.matrix; must contain at minimum two columns: the first column must contain the column names of the expression.matrix, while the last column is assumed to contain the experimental conditions that will be tested for differential expression; a list (of the same length as modality) can be provided if #'
length(modality) > 1- top.annotation.ids
a vector of column indices denoting which columns of the metadata should become heatmap annotations
- n.abundant
number of most abundant genes to use for the JSI calculation
- show.values
whether to show the JSI values within the heatmap squares
- show.row.column.names
whether to show the row and column names below the heatmap; default is TRUE
Examples
expression.matrix.preproc <- as.matrix(read.csv(
  system.file("extdata", "expression_matrix_preprocessed.csv", package = "bulkAnalyseR"),
  row.names = 1
))[1:500,]

metadata <- data.frame(
  srr = colnames(expression.matrix.preproc),
  timepoint = rep(c("0h", "12h", "36h"), each = 2)
)
print(jaccard_heatmap(expression.matrix.preproc, metadata, n.abundant = 100))