Feature Stability Incremental Boxplot
Source:R/stability-based-parameter-assessment.R
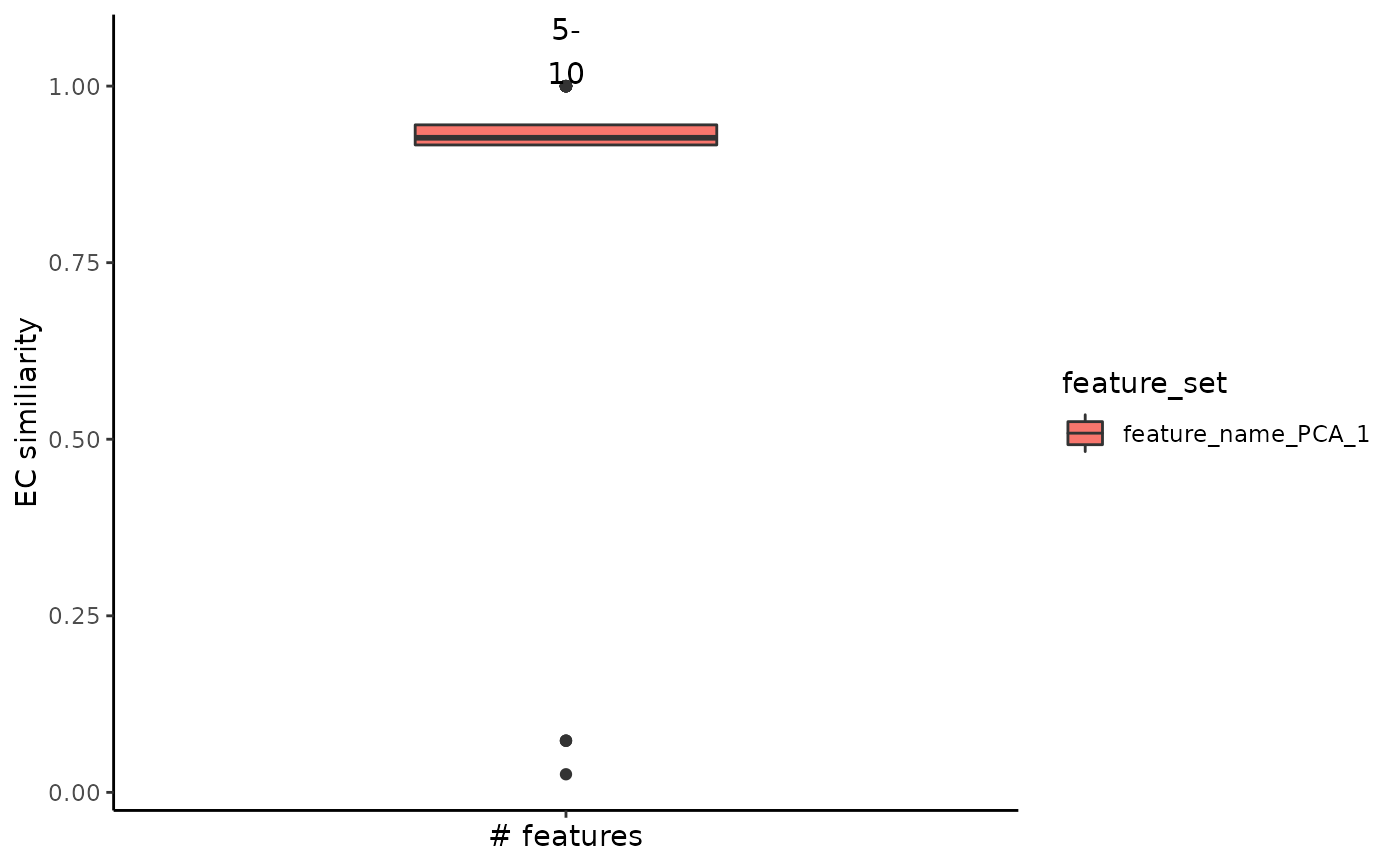
plot_feature_stability_ecs_incremental.RdPerform an incremental ECS between two consecutive feature steps.
plot_feature_stability_ecs_incremental(
  feature_object_list,
  dodge_width = 0.7,
  text_size = 4,
  boxplot_width = 0.4
)
Arguments
- feature_object_list
An object or a concatenation of objects returned by the `get_feature_stability` method.
- dodge_width
Used for adjusting the horizontal position of the boxplot; the value will be passed to the `width` argument of the `ggplot2::position_dodge` method.
- text_size
The size of the labels above boxplots.
- boxplot_width
Used for adjusting the width of the boxplots; the value will be passed to the `width` argument of the `ggplot2::geom_boxplot` method.
Value
A ggplot2 object with ECS distribution will be displayed as a boxplot. Above each boxplot there will be a pair of numbers representing the two steps that are compared.
Examples
set.seed(2021)
# create an artificial expression matrix
expr_matrix = matrix(c(runif(25*10), runif(75*10, min = 5, max = 7)), nrow = 100, byrow = TRUE)
rownames(expr_matrix) = as.character(1:100)
colnames(expr_matrix) = paste("feature", 1:10)

feature_stability_result = get_feature_stability(data_matrix = t(expr_matrix),
   feature_set = colnames(expr_matrix),
   feature_type = "feature_name",
   steps = c(5,10),
   npcs = 2,
   n_repetitions = 3,
   algorithm = 1,
   # the following parameters are used by the umap function and are not mandatory
   n_neighbors = 3,
   approx_pow = TRUE,
   n_epochs = 0,
   init = "random",
   min_dist = 0.3)
plot_feature_stability_ecs_incremental(feature_stability_result)