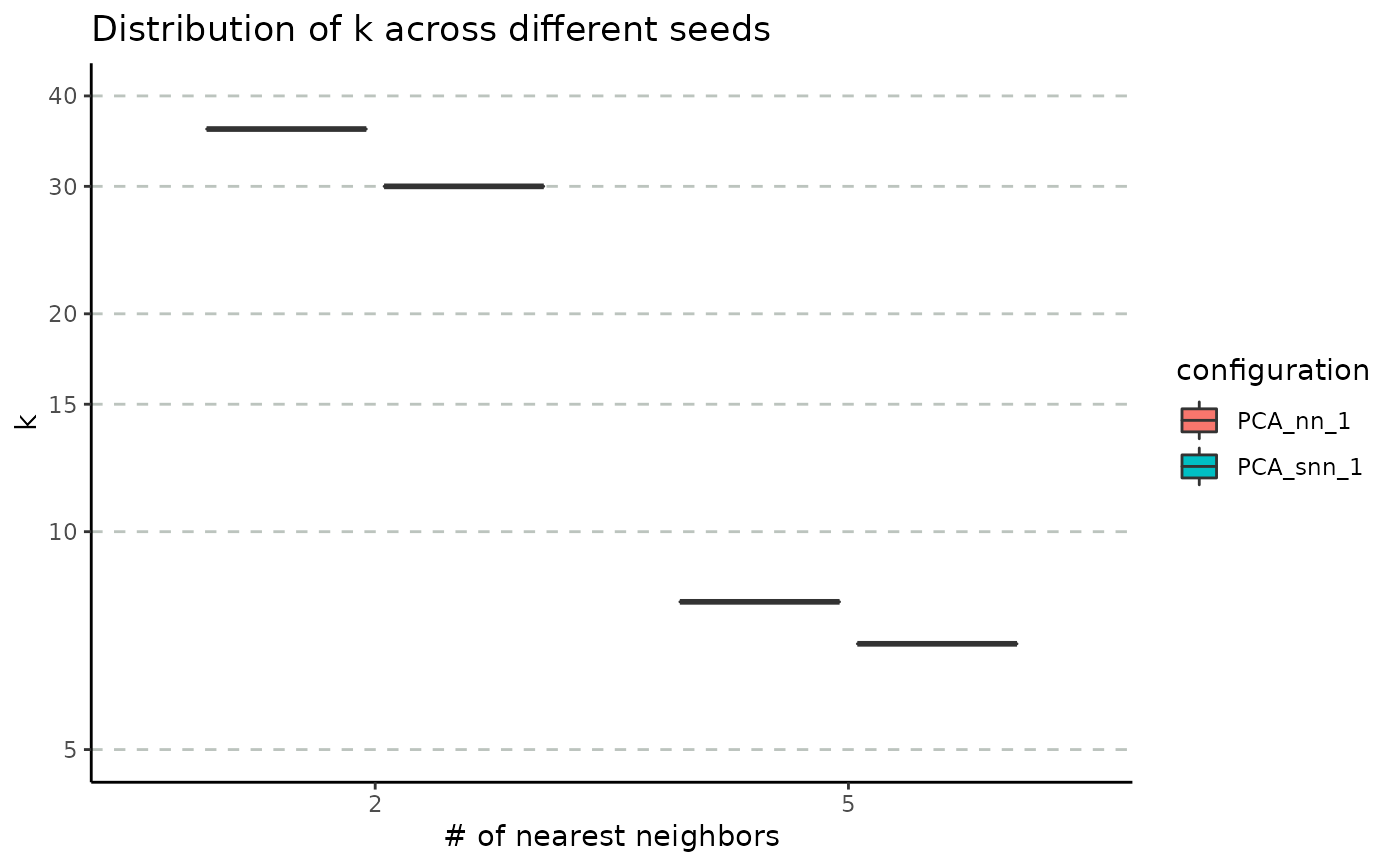
Relationship Between Number of Nearest Neighbours and Number of Clusters
Source:R/stability-2-graph-construction.R
plot_n_neigh_k_correspondence.RdDisplay the distribution of the number of clusters obtained for each number of neighbours across random seeds.
Examples
set.seed(2024)
# create an artificial PCA embedding
pca_emb <- matrix(runif(100 * 30), nrow = 100, byrow = TRUE)
rownames(pca_emb) <- as.character(1:100)
colnames(pca_emb) <- paste0("PC_", 1:30)

nn_stability_obj <- assess_nn_stability(
    embedding = pca_emb,
    n_neigh_sequence = c(10, 15, 20),
    n_repetitions = 10,
    graph_reduction_type = "PCA",
    clustering_algorithm = 1
)
plot_n_neigh_k_correspondence(nn_stability_obj)
#> Warning: log-10 transformation introduced infinite values.