Correspondence Between Resolution and the Number of Clusters
Source:R/stability-3-graph-clustering.R
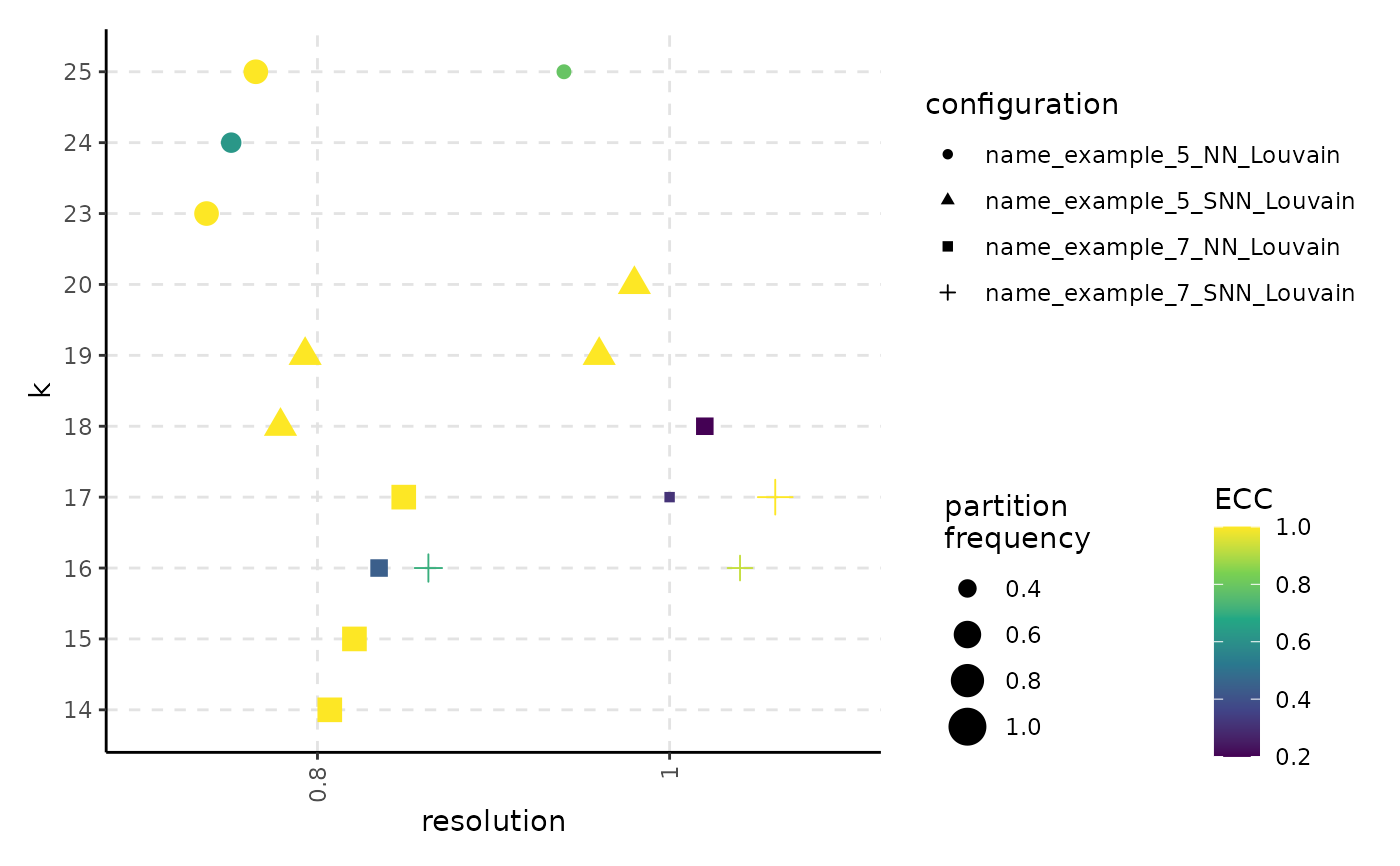
plot_k_resolution_corresp.RdFor each configuration provided in the clust_object, display what number of clusters appear for different values of the resolution parameters.
Arguments
- clust_object
An object returned by the
assess_clustering_stabilitymethod.- colour_information
String that specifies the information type that will be illustrated using gradient colour: either
freq_partfor the frequency of the most common partition oreccfor the Element-Centric Consistency of the partitions obtained when the the number of clusters is fixed. Defaults toecc.- dodge_width
Used for adjusting the distance between the boxplots representing a clustering method. Defaults to
0.3.- pt_size_range
Indicates the minimum and the maximum size a point on the plot can have. Defaults to
c(1.5, 4).- summary_function
The function that will be used to summarize the distribution of the ECC values obtained for each number of clusters. Defaults to
median.
Value
A ggplot2 object. Different shapes of points indicate different parameter configuration, while the color illustrates the frequency of the most common partition or the Element-Centric Consistency of the partitions. The frequency is calculated as the fraction between the number of total appearances of partitions with a specific number of clusters and resolution value and the number of runs. The size illustrates the frequency of the most common partition with k clusters relative to the partitions obtained with the same resolution value and have k clusters.
Examples
set.seed(2024)
# create an artificial PCA embedding
pca_embedding <- matrix(runif(100 * 30), nrow = 100)
rownames(pca_embedding) <- paste0("cell_", seq_len(nrow(pca_embedding)))
colnames(pca_embedding) <- paste0("PC_", 1:30)


adj_matrix <- getNNmatrix(
    RANN::nn2(pca_embedding, k = 10)$nn.idx,
    10,
    0,
    -1
)$nn
rownames(adj_matrix) <- paste0("cell_", seq_len(nrow(adj_matrix)))
colnames(adj_matrix) <- paste0("cell_", seq_len(ncol(adj_matrix)))

# alternatively, the adj_matrix can be calculated
# using the `Seurat::FindNeighbors` function.

clust_diff_obj <- assess_clustering_stability(
    graph_adjacency_matrix = adj_matrix,
    resolution = c(0.5, 1),
    n_repetitions = 10,
    clustering_algorithm = 1:2,
    verbose = FALSE
)
plot_k_resolution_corresp(clust_diff_obj)