Feature Stability - Cluster Membership Facet Plot
Source:R/stability-1-dim-reduction.R
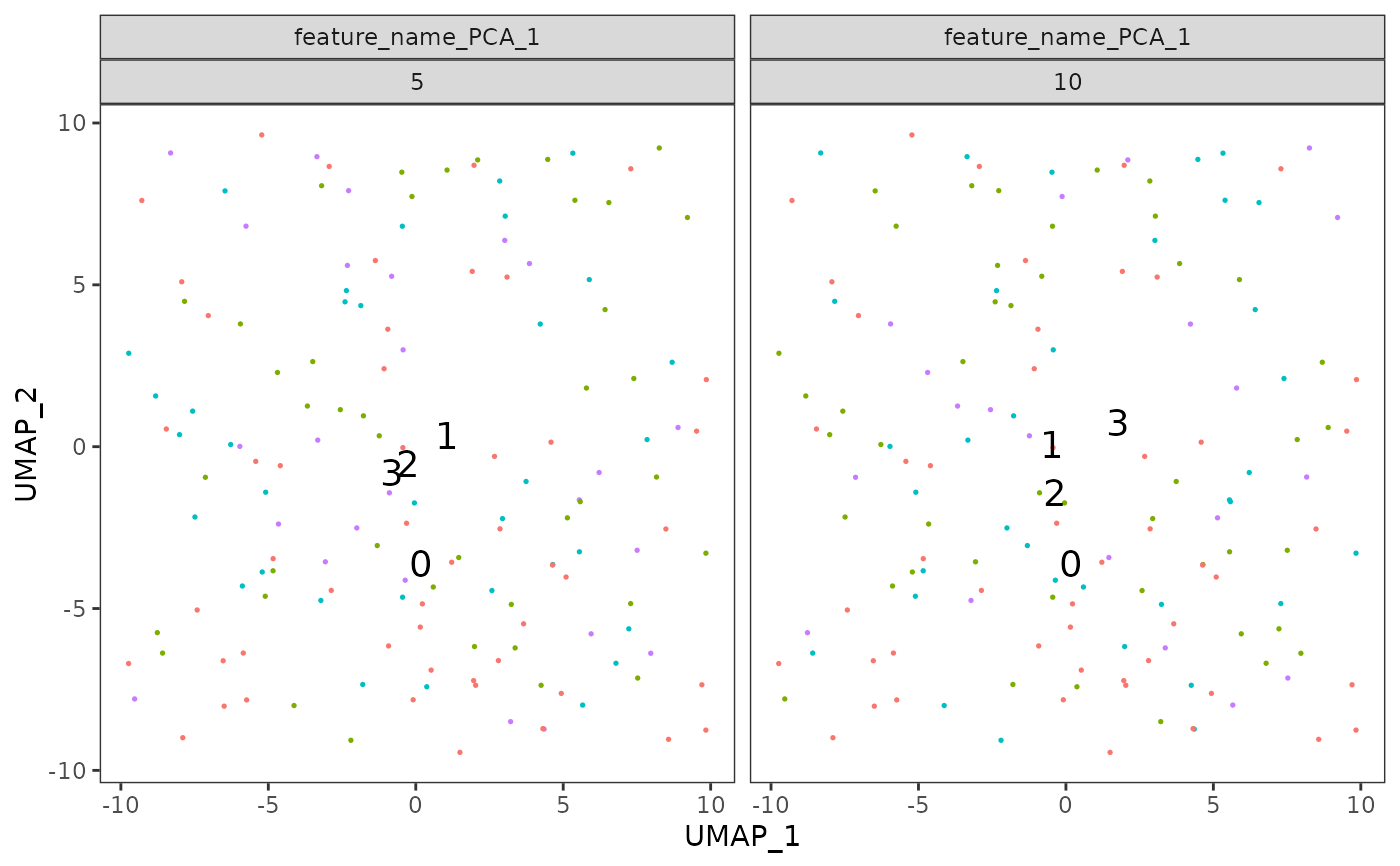
plot_feature_stability_mb_facet.RdDisplay a facet of plots where each subpanel is associated with a feature set and illustrates the distribution of the most frequent partition over the UMAP embedding.
Usage
plot_feature_stability_mb_facet(
  feature_object_list,
  resolution,
  text_size = 5,
  n_facet_cols = 3,
  point_size = 0.3
)
Arguments
- feature_object_list
An object or a concatenation of objects returned by the
assess_feature_stabilitymethod- resolution
The resolution value for which the ECS will be extracted.
- text_size
The size of the cluster label
- n_facet_cols
The number of facet's columns.
- point_size
The size of the points displayed on the plot.
Examples
set.seed(2024)
# create an artificial expression matrix
expr_matrix <- matrix(
    c(runif(100 * 10), runif(50 * 10, min = 3, max = 4)),
    nrow = 150, byrow = TRUE
)
rownames(expr_matrix) <- as.character(1:150)
colnames(expr_matrix) <- paste("feature", 1:10)

feature_stability_result <- assess_feature_stability(
    data_matrix = t(expr_matrix),
    feature_set = colnames(expr_matrix),
    steps = 5,
    feature_type = "feature_name",
    resolution = c(0.1, 0.5, 1),
    n_repetitions = 10,
    clustering_algorithm = 1
)
plot_feature_stability_mb_facet(
    feature_stability_result,
    0.5,
    point_size = 2
)