Relationship Between Number of Nearest Neighbours and Graph Connectivity
Source:R/stability-2-graph-construction.R
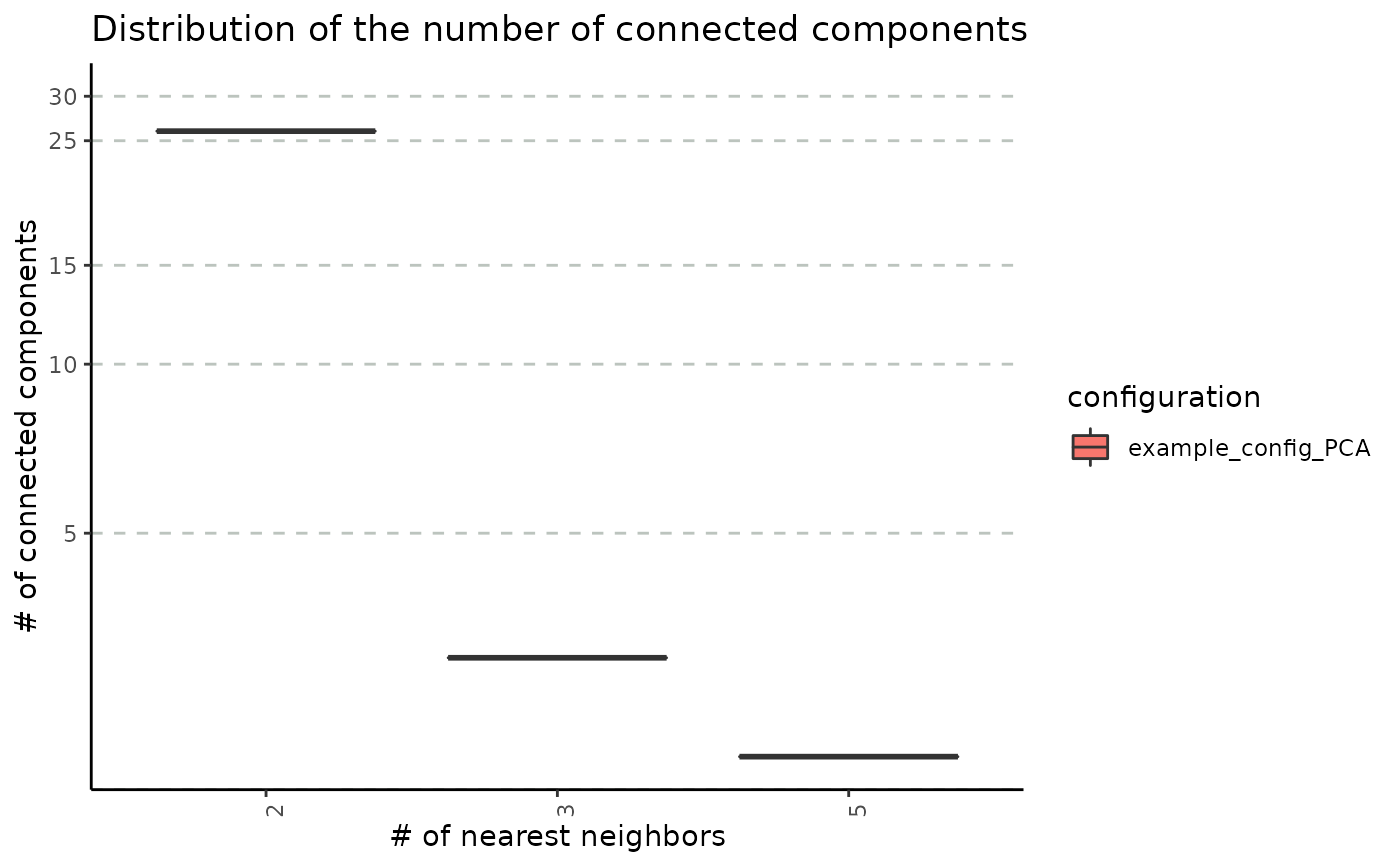
plot_connected_comps_evolution.RdDisplay the distribution of the number connected components obtained for each number of neighbours across random seeds.
Examples
set.seed(2024)
# create an artificial PCA embedding
pca_emb <- matrix(runif(100 * 30), nrow = 100, byrow = TRUE)
rownames(pca_emb) <- as.character(1:100)
colnames(pca_emb) <- paste0("PCA_", 1:30)

nn_conn_comps_obj <- get_nn_conn_comps(
    embedding = pca_emb,
    n_neigh_sequence = c(2, 5),
    n_repetitions = 3,
    # arguments that are passed to the uwot function
    umap_arguments = list(
        min_dist = 0.3,
        metric = "cosine"
    )
)
plot_connected_comps_evolution(nn_conn_comps_obj)
#> Warning: log-10 transformation introduced infinite values.