Hierarchical relationship between partitions with different number of clusters
Source:R/stability-3-graph-clustering.R
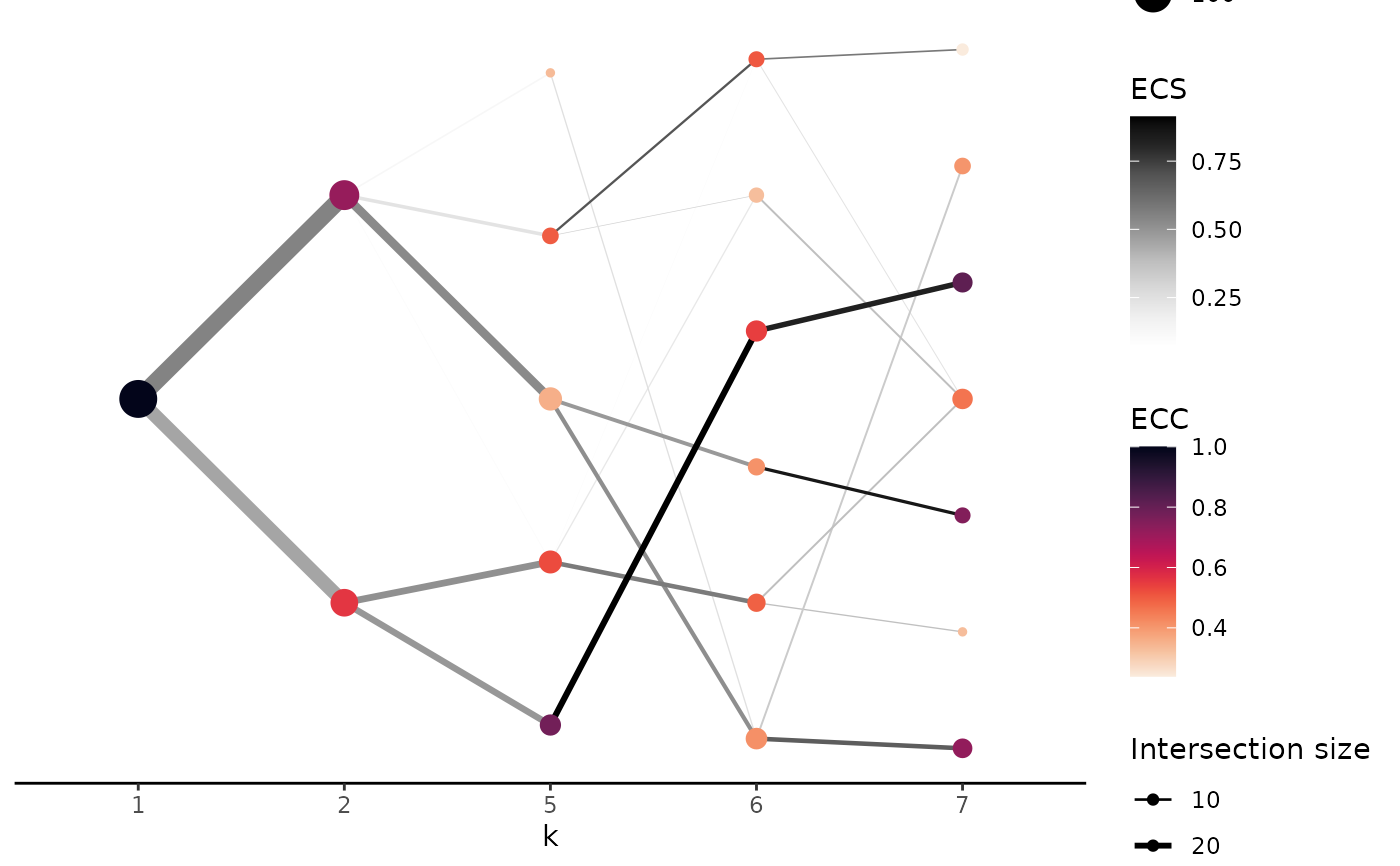
plot_clust_hierarchical.RdAfter assessing the stability of the clustering step, the user can visualise the relationship between the partitions as the number of clusters changes. The aim is to understand the hierarchical relationship between super and sub celltypes. The function will create a plot that will represent the clusters of each partition as nodes. The colours of the nodes will indicate the stability of the cluster. The size is proportional to the number of cells in the cluster. The edges will represent the relationship between the clusters of two partitions. The colour of the edges will indicate the stability of the relationship between the clusters. The thickness of the edges will indicate the number of cells that are shared between the two clusters.
Usage
plot_clust_hierarchical(
  clustering_assessment,
  clustering_method = NULL,
  k = NULL,
  edge_threshold = 0.3,
  range_point_size = c(1, 6),
  range_edge_width = c(0.01, 3),
  edge_palette_name = "RColorBrewer::Greys",
  edge_palette_inverse = FALSE,
  node_palette_name = "viridis::rocket",
  node_palette_inverse = TRUE
)
Arguments
- clustering_assessment
An object returned by the
assess_clustering_stabilitymethod.- clustering_method
A string that specifies the clustering method. Should be one of the following: 'Louvain', 'Louvain.refined', 'SLM', 'Leiden'. If
NULL, the first clustering method will be used. Defaults toNULL.- k
A vector of integers that specifies the number of clusters. If
NULL, all available values will be used. Defaults toNULL.- edge_threshold
A numeric value that specifies the quantile threshold for the edges. The edges with the intersection size below the quantile threshold will be removed. Defaults to
0.3.- range_point_size
A numeric vector of length 2 that specifies the minimum and the maximum size of the nodes. Defaults to
c(1, 6).- range_edge_width
A numeric vector of length 2 that specifies the minimum and the maximum width of the edges. Defaults to
c(0.01, 3).- edge_palette_name
A string that specifies the name of the palette that will be used for the edges. Defaults to
"RColorBrewer::Greys".- edge_palette_inverse
A boolean value that specifies whether the palette should be inverted. Defaults to
FALSE.- node_palette_name
A string that specifies the name of the palette that will be used for the nodes. Defaults to
"viridis::rocket".- node_palette_inverse
A boolean value that specifies whether the palette should be inverted. Defaults to
TRUE.
Examples
set.seed(2024)
# create an artificial PCA embedding
pca_embedding <- matrix(runif(100 * 30), nrow = 100)
rownames(pca_embedding) <- paste0("cell_", seq_len(nrow(pca_embedding)))
colnames(pca_embedding) <- paste0("PC_", 1:30)


adj_matrix <- getNNmatrix(
    RANN::nn2(pca_embedding, k = 10)$nn.idx,
    10,
    0,
    -1
)$nn
rownames(adj_matrix) <- paste0("cell_", seq_len(nrow(adj_matrix)))
colnames(adj_matrix) <- paste0("cell_", seq_len(ncol(adj_matrix)))

# alternatively, the adj_matrix can be calculated
# using the `Seurat::FindNeighbors` function.

clust_diff_obj <- assess_clustering_stability(
    graph_adjacency_matrix = adj_matrix,
    resolution = c(0.5, 1),
    n_repetitions = 10,
    clustering_algorithm = 1:2,
    verbose = TRUE
)
plot_clust_hierarchical(clust_diff_obj)