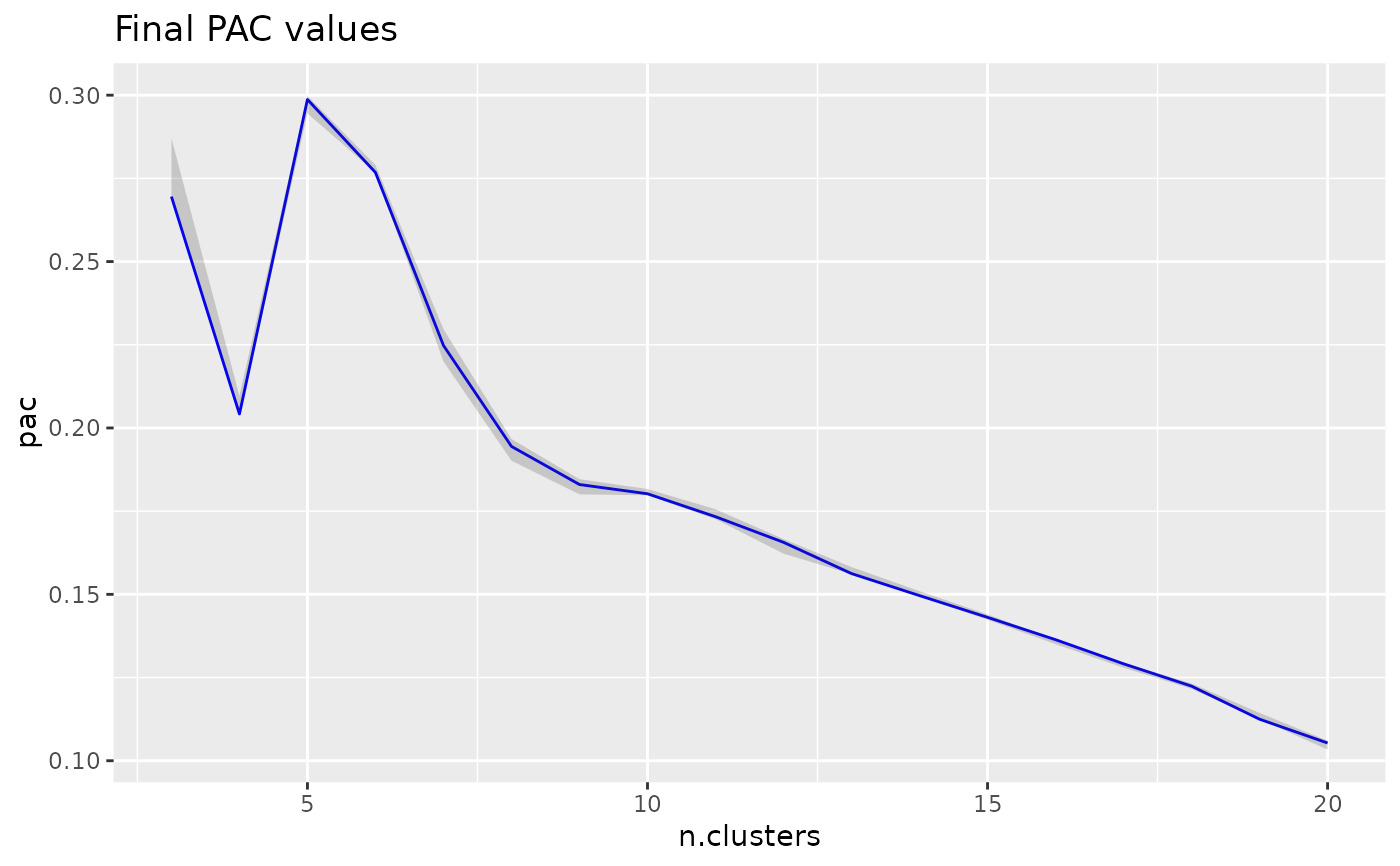
Plot final PAC values across range of k to find optimal number of clusters.
Usage
pac_landscape(pac_res, n_shade = max(pac_res$iteration)/5)Value
A ggplot2 object with the final PAC vs k plot. A local minimum in the landscape indicates an especially stable value of k.
Examples
pac.res <- consensus_cluster(iris[, 1:4], k_max = 20)
#> Calculating consensus clustering
pac_landscape(pac.res)