Plot PAC across iterations for a set of k to assess convergence.
Value
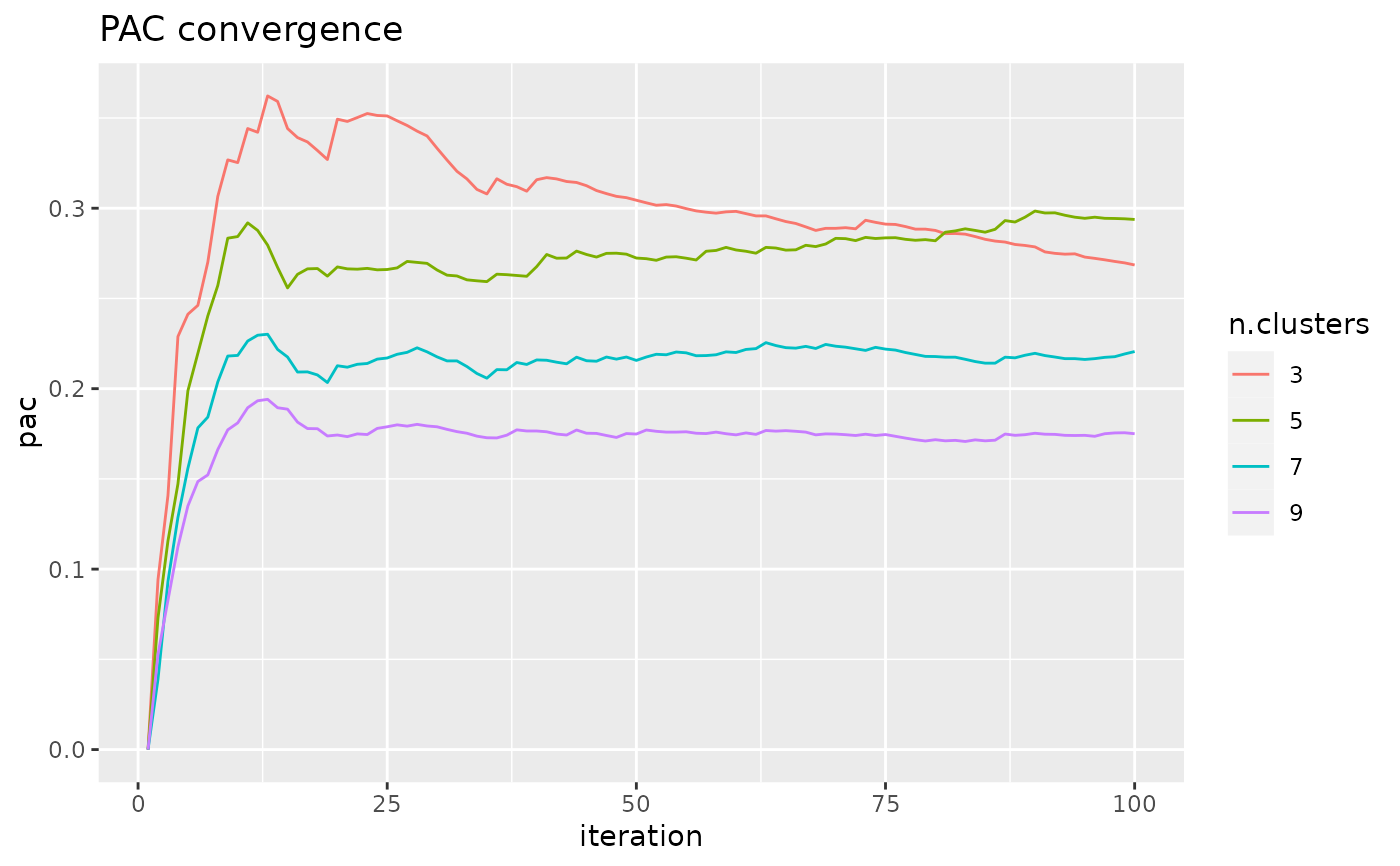
A ggplot2 object with the convergence plot. Convergence has been reached when the lines flatten out across k_plot values. out across
Examples
pac.res <- consensus_cluster(iris[, 1:4], k_max = 20)
#> Calculating consensus clustering
pac_convergence(pac.res, k_plot = c(3, 5, 7, 9))